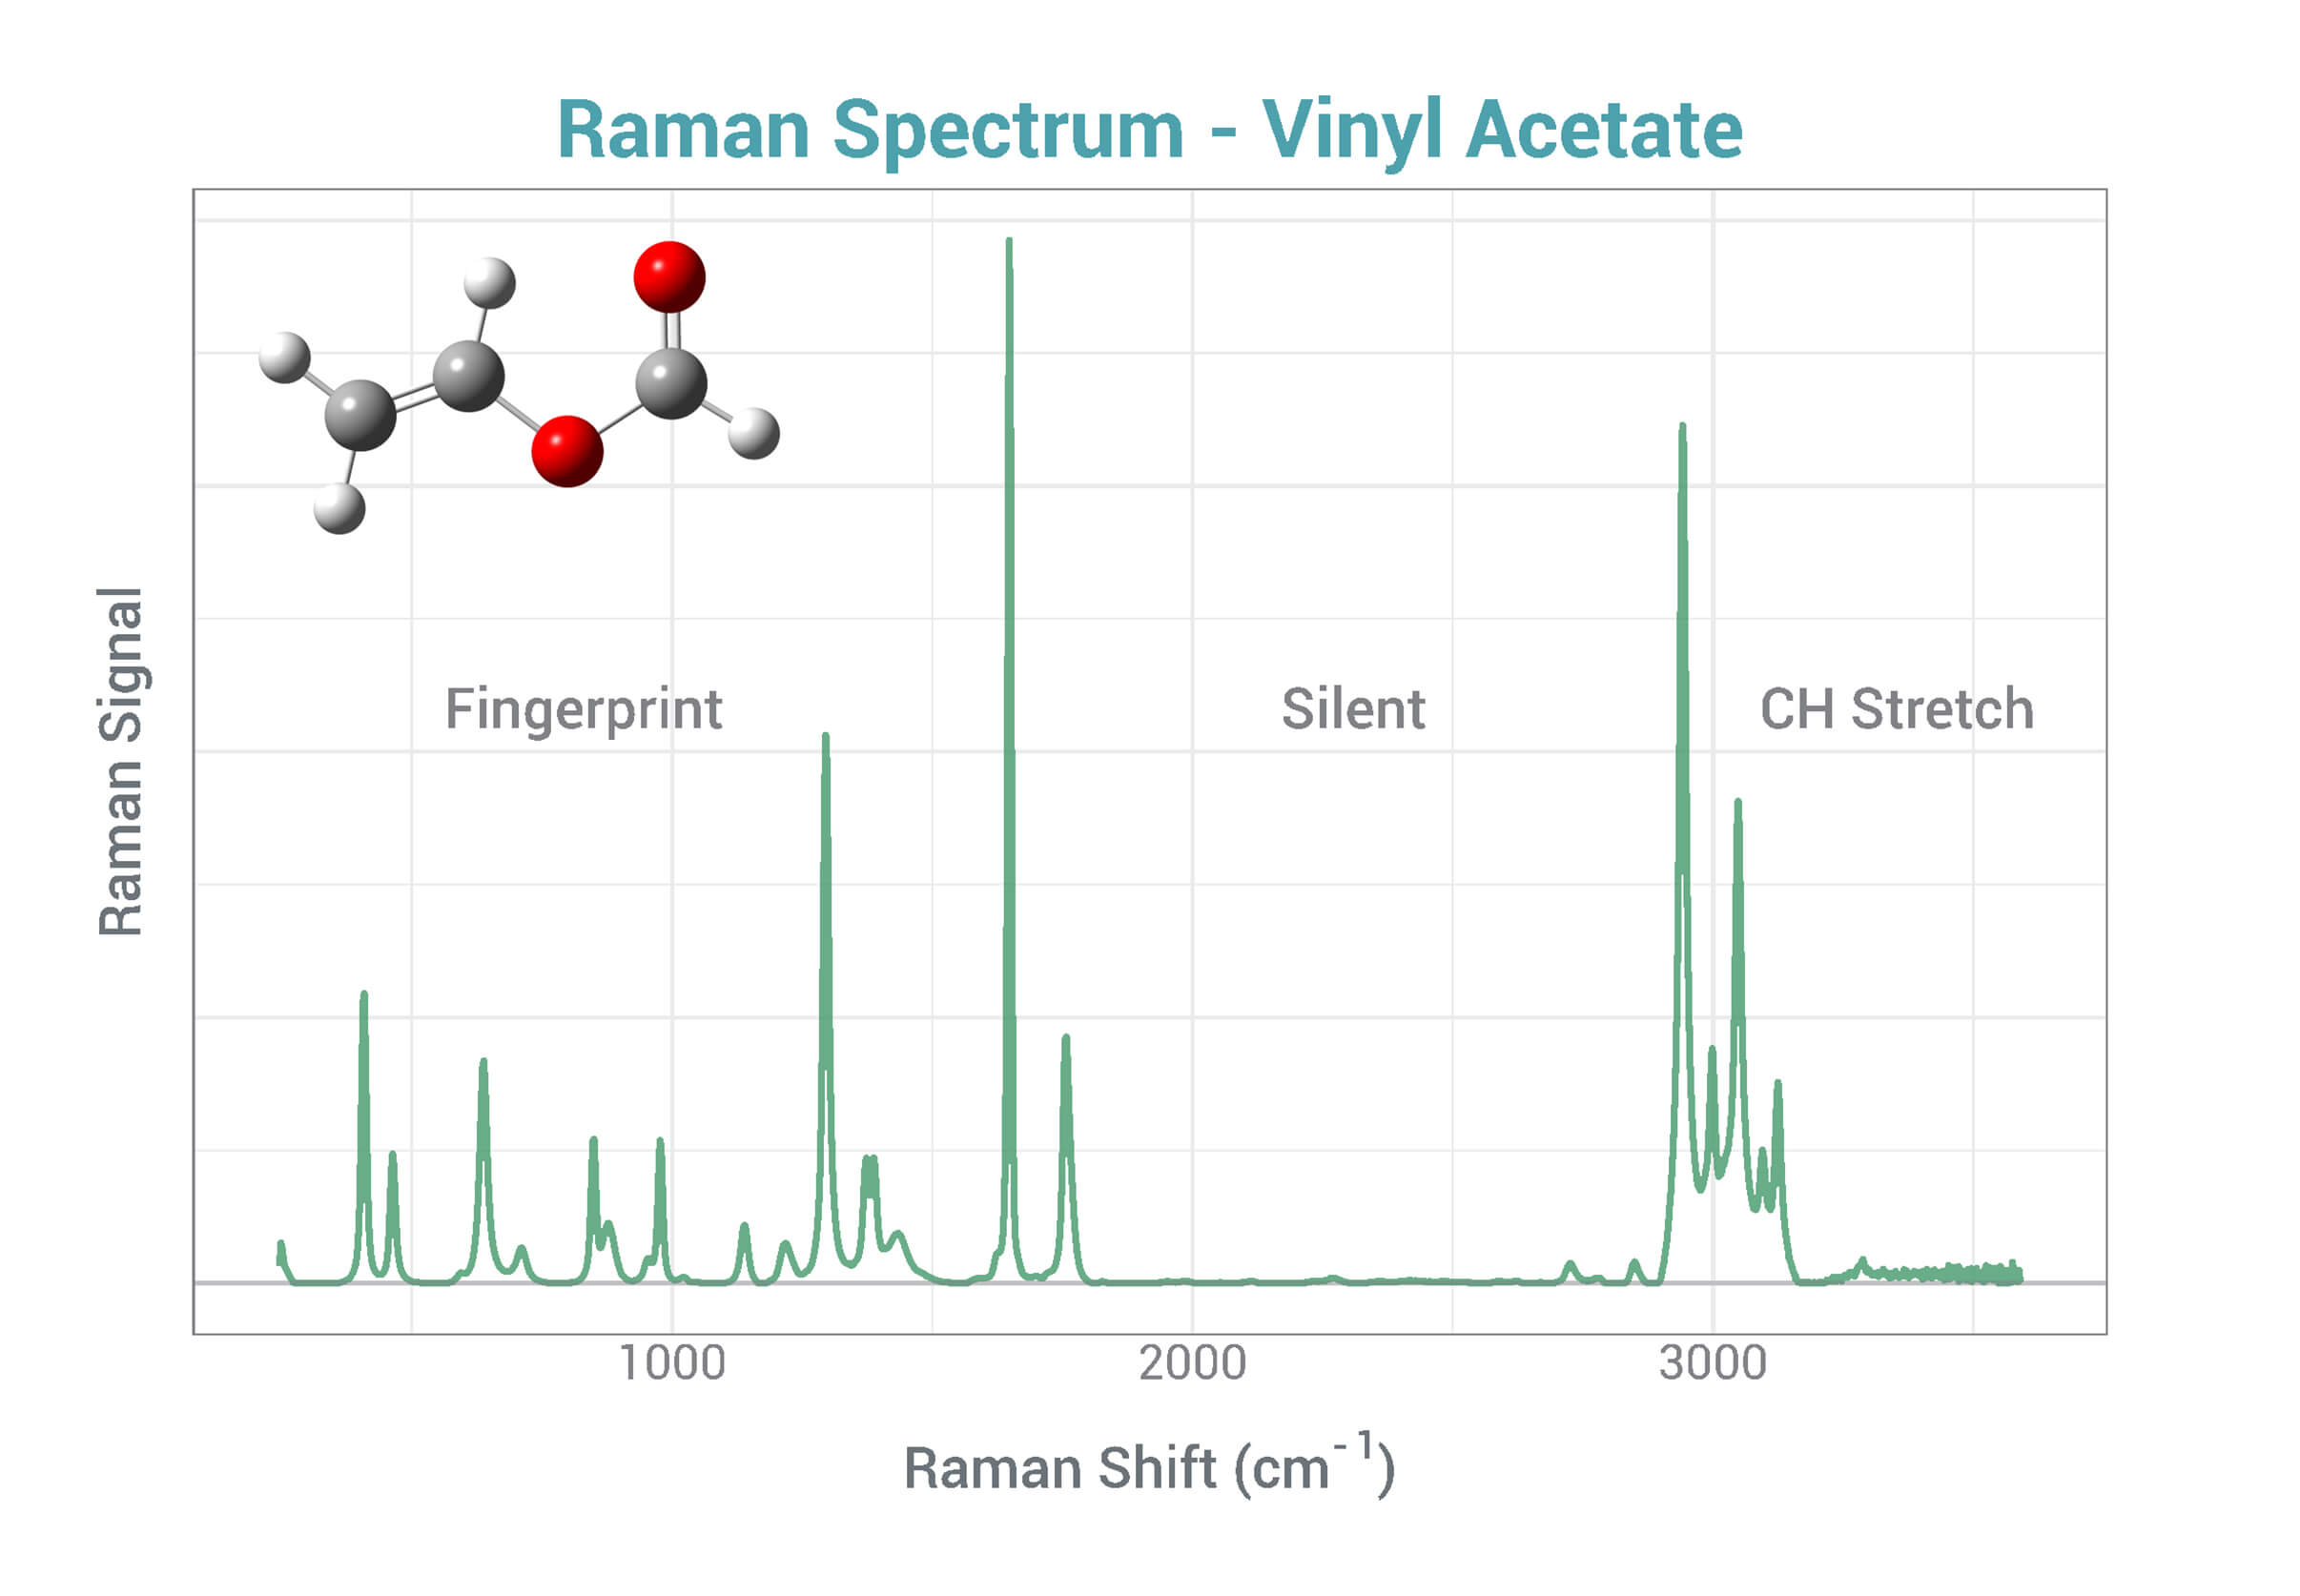
Each Raman spectrum is made up of a series of Raman peaks, with each peak representing the vibrational, rotational, or other low-frequency modes of the excited molecule. Each spectral band reflects a specific amount of energy lost or gained by scattered photons, creating a unique chemical fingerprint that is the basis for Raman identification.
The RAMAN SPECTRUM is often considered to consist of distinct regions:
•
Low-frequency region (< 200 cm-1), showing lattice motions of molecules in a crystal;
•
Fingerprint region (200–1800 cm-1), showing extended skeleton motions of the molecule;
•
Functional group region (> 1800 cm-1), showing local motions characteristic of functional groups, often sub-divided into the:
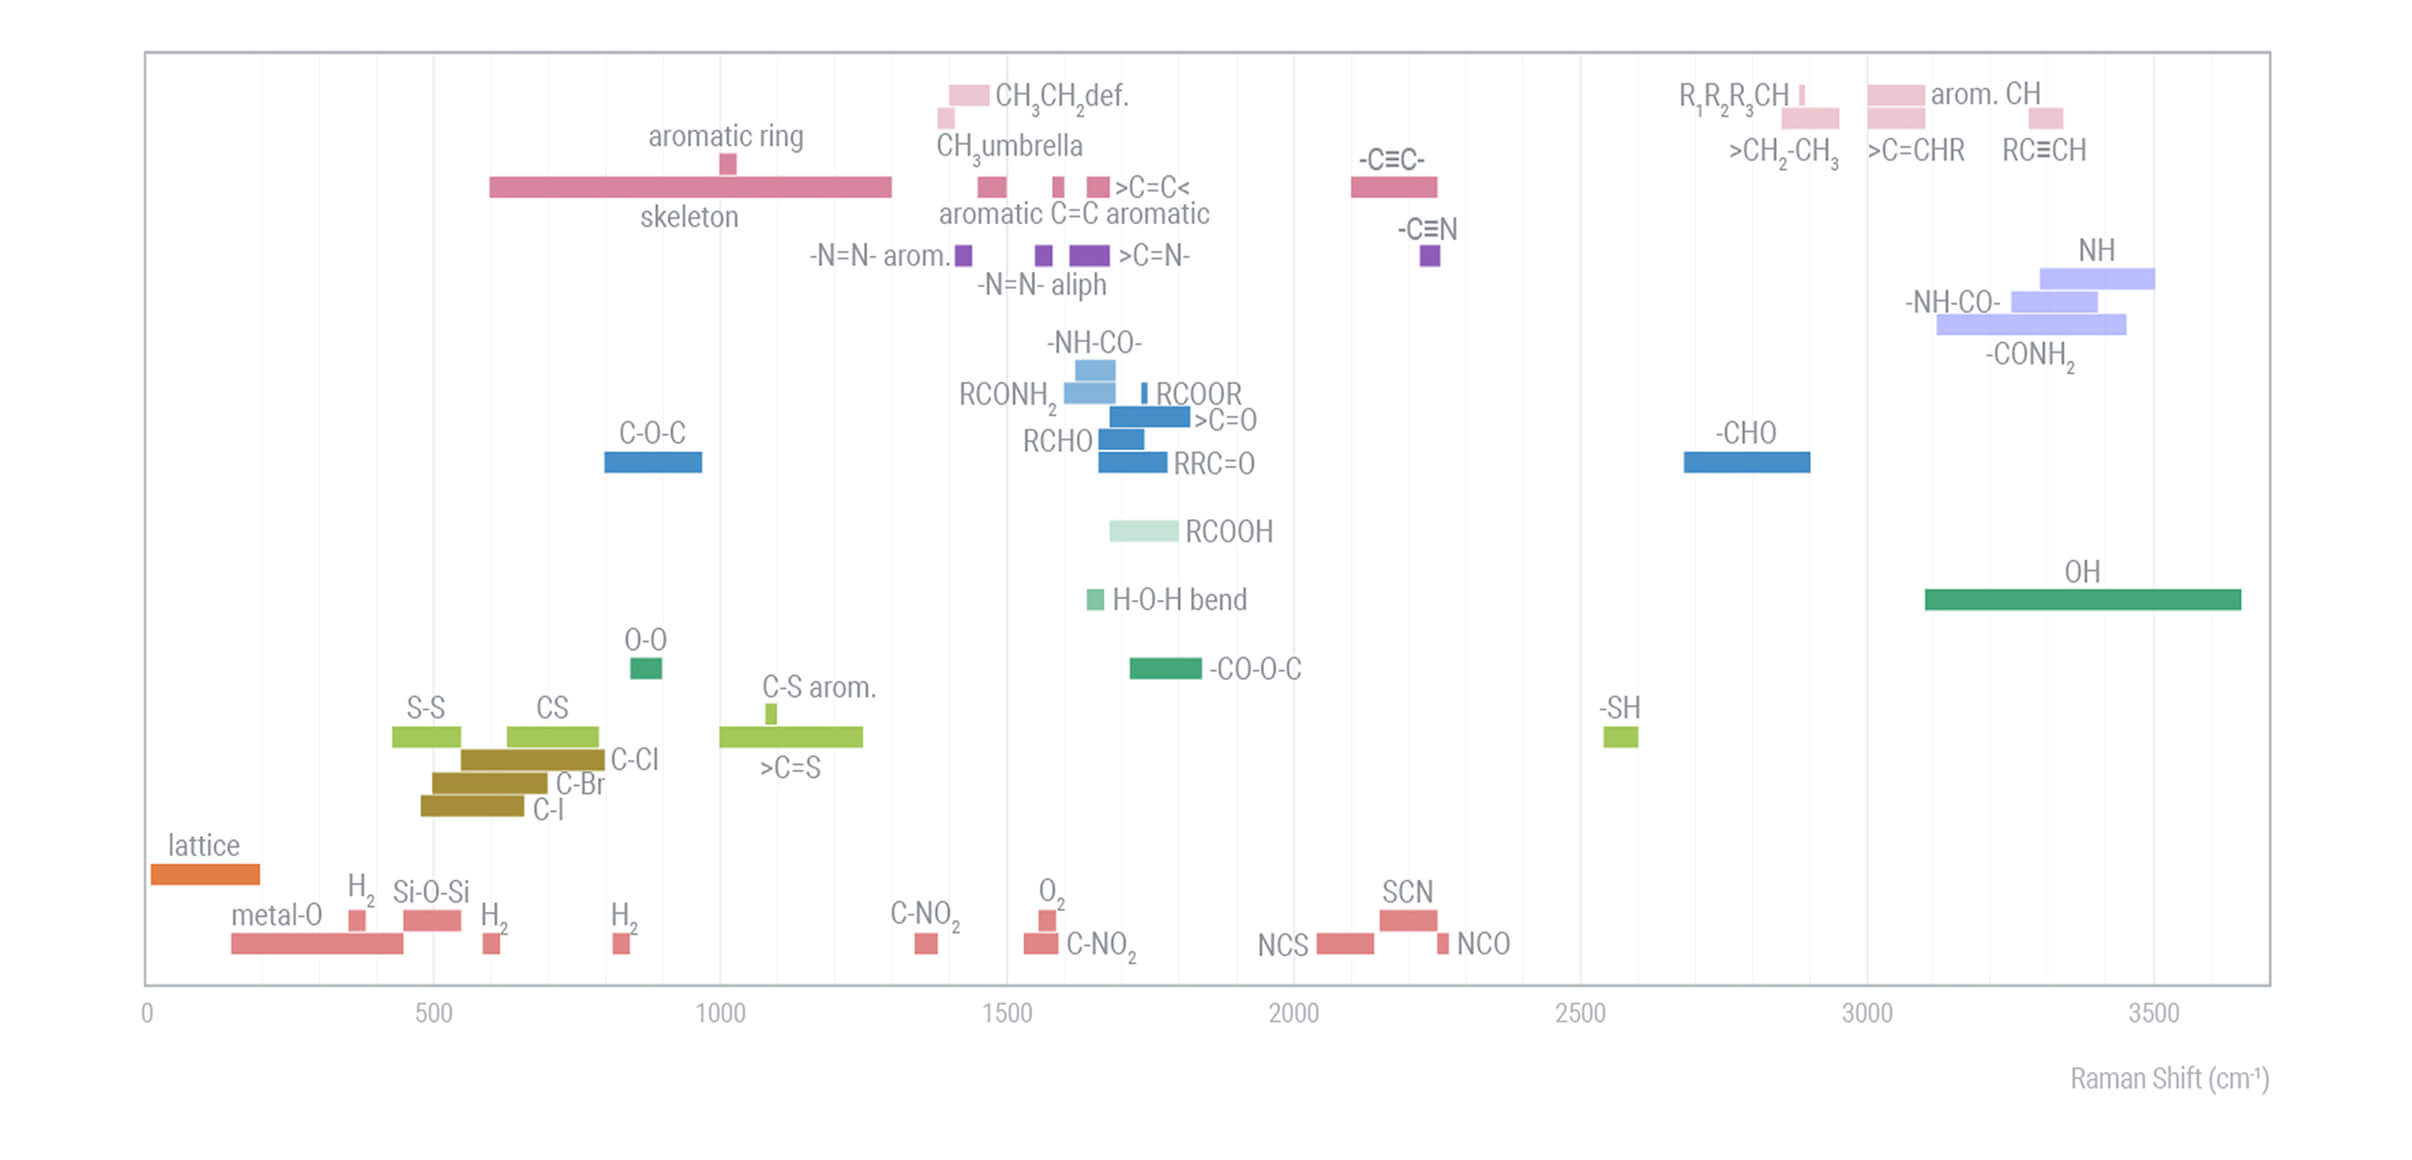
Raman Bands
Vibrational frequencies of common bands observed in a Raman spectrum, colored by the type of chemical motif the band indicates.
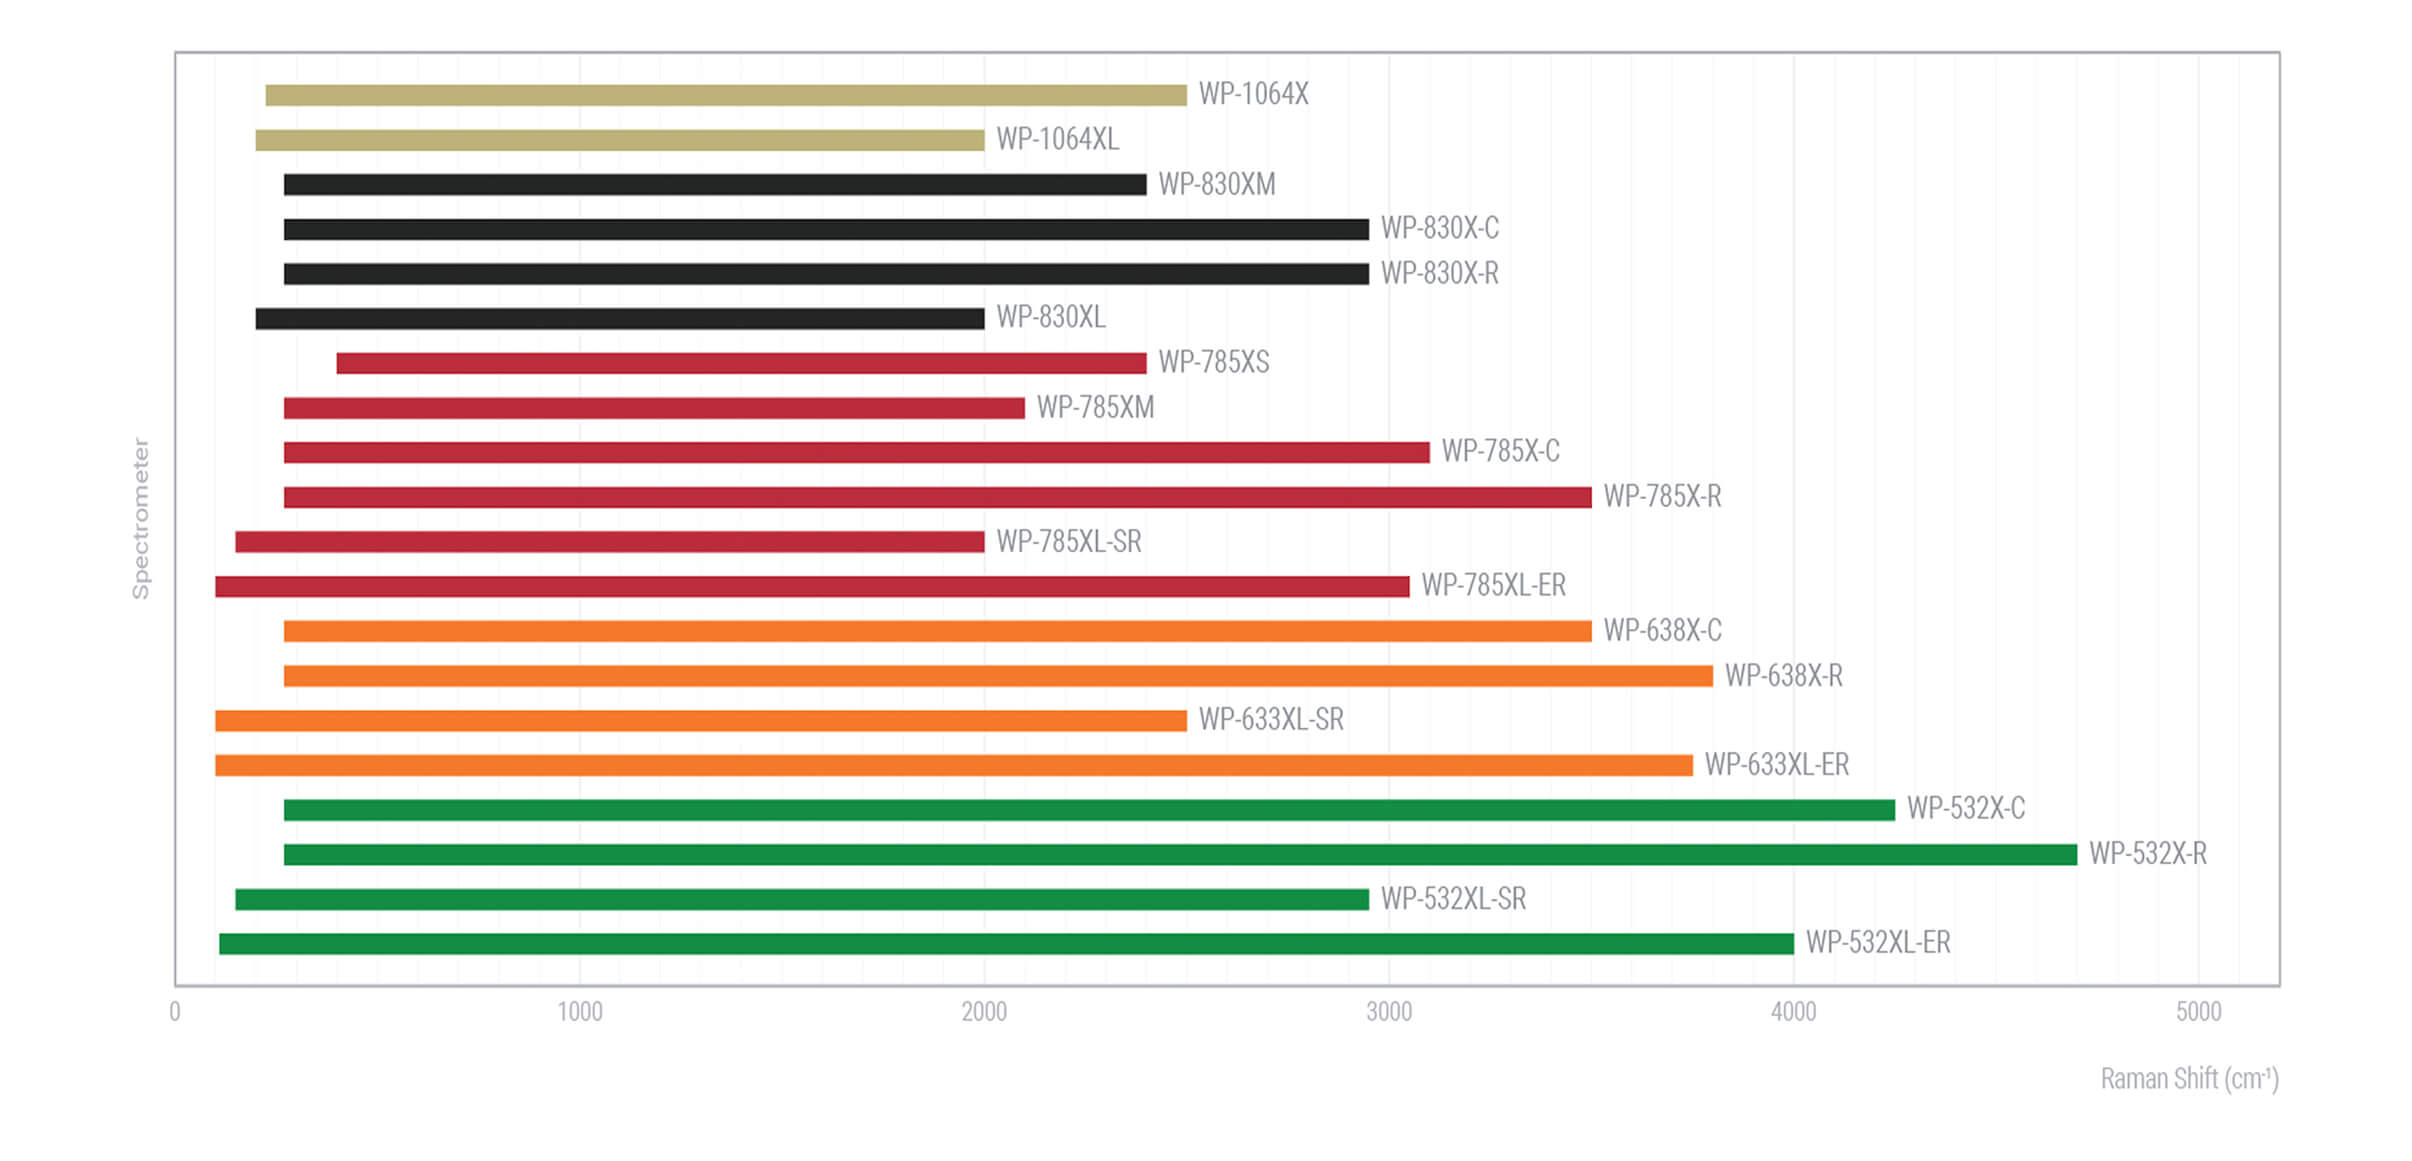
Wasatch Raman Product Spectral Range
Raman shift spectral range covered by each of the Wasatch Raman systems offered.
Misty Johnson is responsible for taking care of our grating customers at the Logan, Utah, facility. She has been a member of the Wasatch Photonics team since 2009. By understanding her customers’ needs and goals, as well as the current grating market, Misty is able to provide a superior level of customer support. As Account Manager, she acts as a liaison between customers and Wasatch Photonics’ manufacturing department making sure that the lines of communication are always open.
Customer support is an integral part of Wasatch Photonics commitment to customers. Whether you are in the market to purchase a single grating, inquiring as a distributor, or purchasing large volume, Misty will guide you seamlessly through the custom design process. Misty strives to build trust and strong long term relationships with Wasatch Photonics customers. She brings 20 years’ experience as customer support manager from a number of manufacturing and service companies.