A rapid detection technique for subsurface, cross-sectional visualization of materials
In 1991, David Huang, Eric Swanson, James Fujimoto, and colleagues at MIT and Harvard Medical School published the first paper on Optical Coherence Tomography (OCT) in Science. The paper introduced the term OCT and showcased the ability to generate cross-sectional images of the human retina with micrometer-scale resolution.
Born in ophthalmology, OCT remains a leading diagnostic tool and has expanded into numerous non-invasive subsurface imaging applications.
An Introduction to OCT
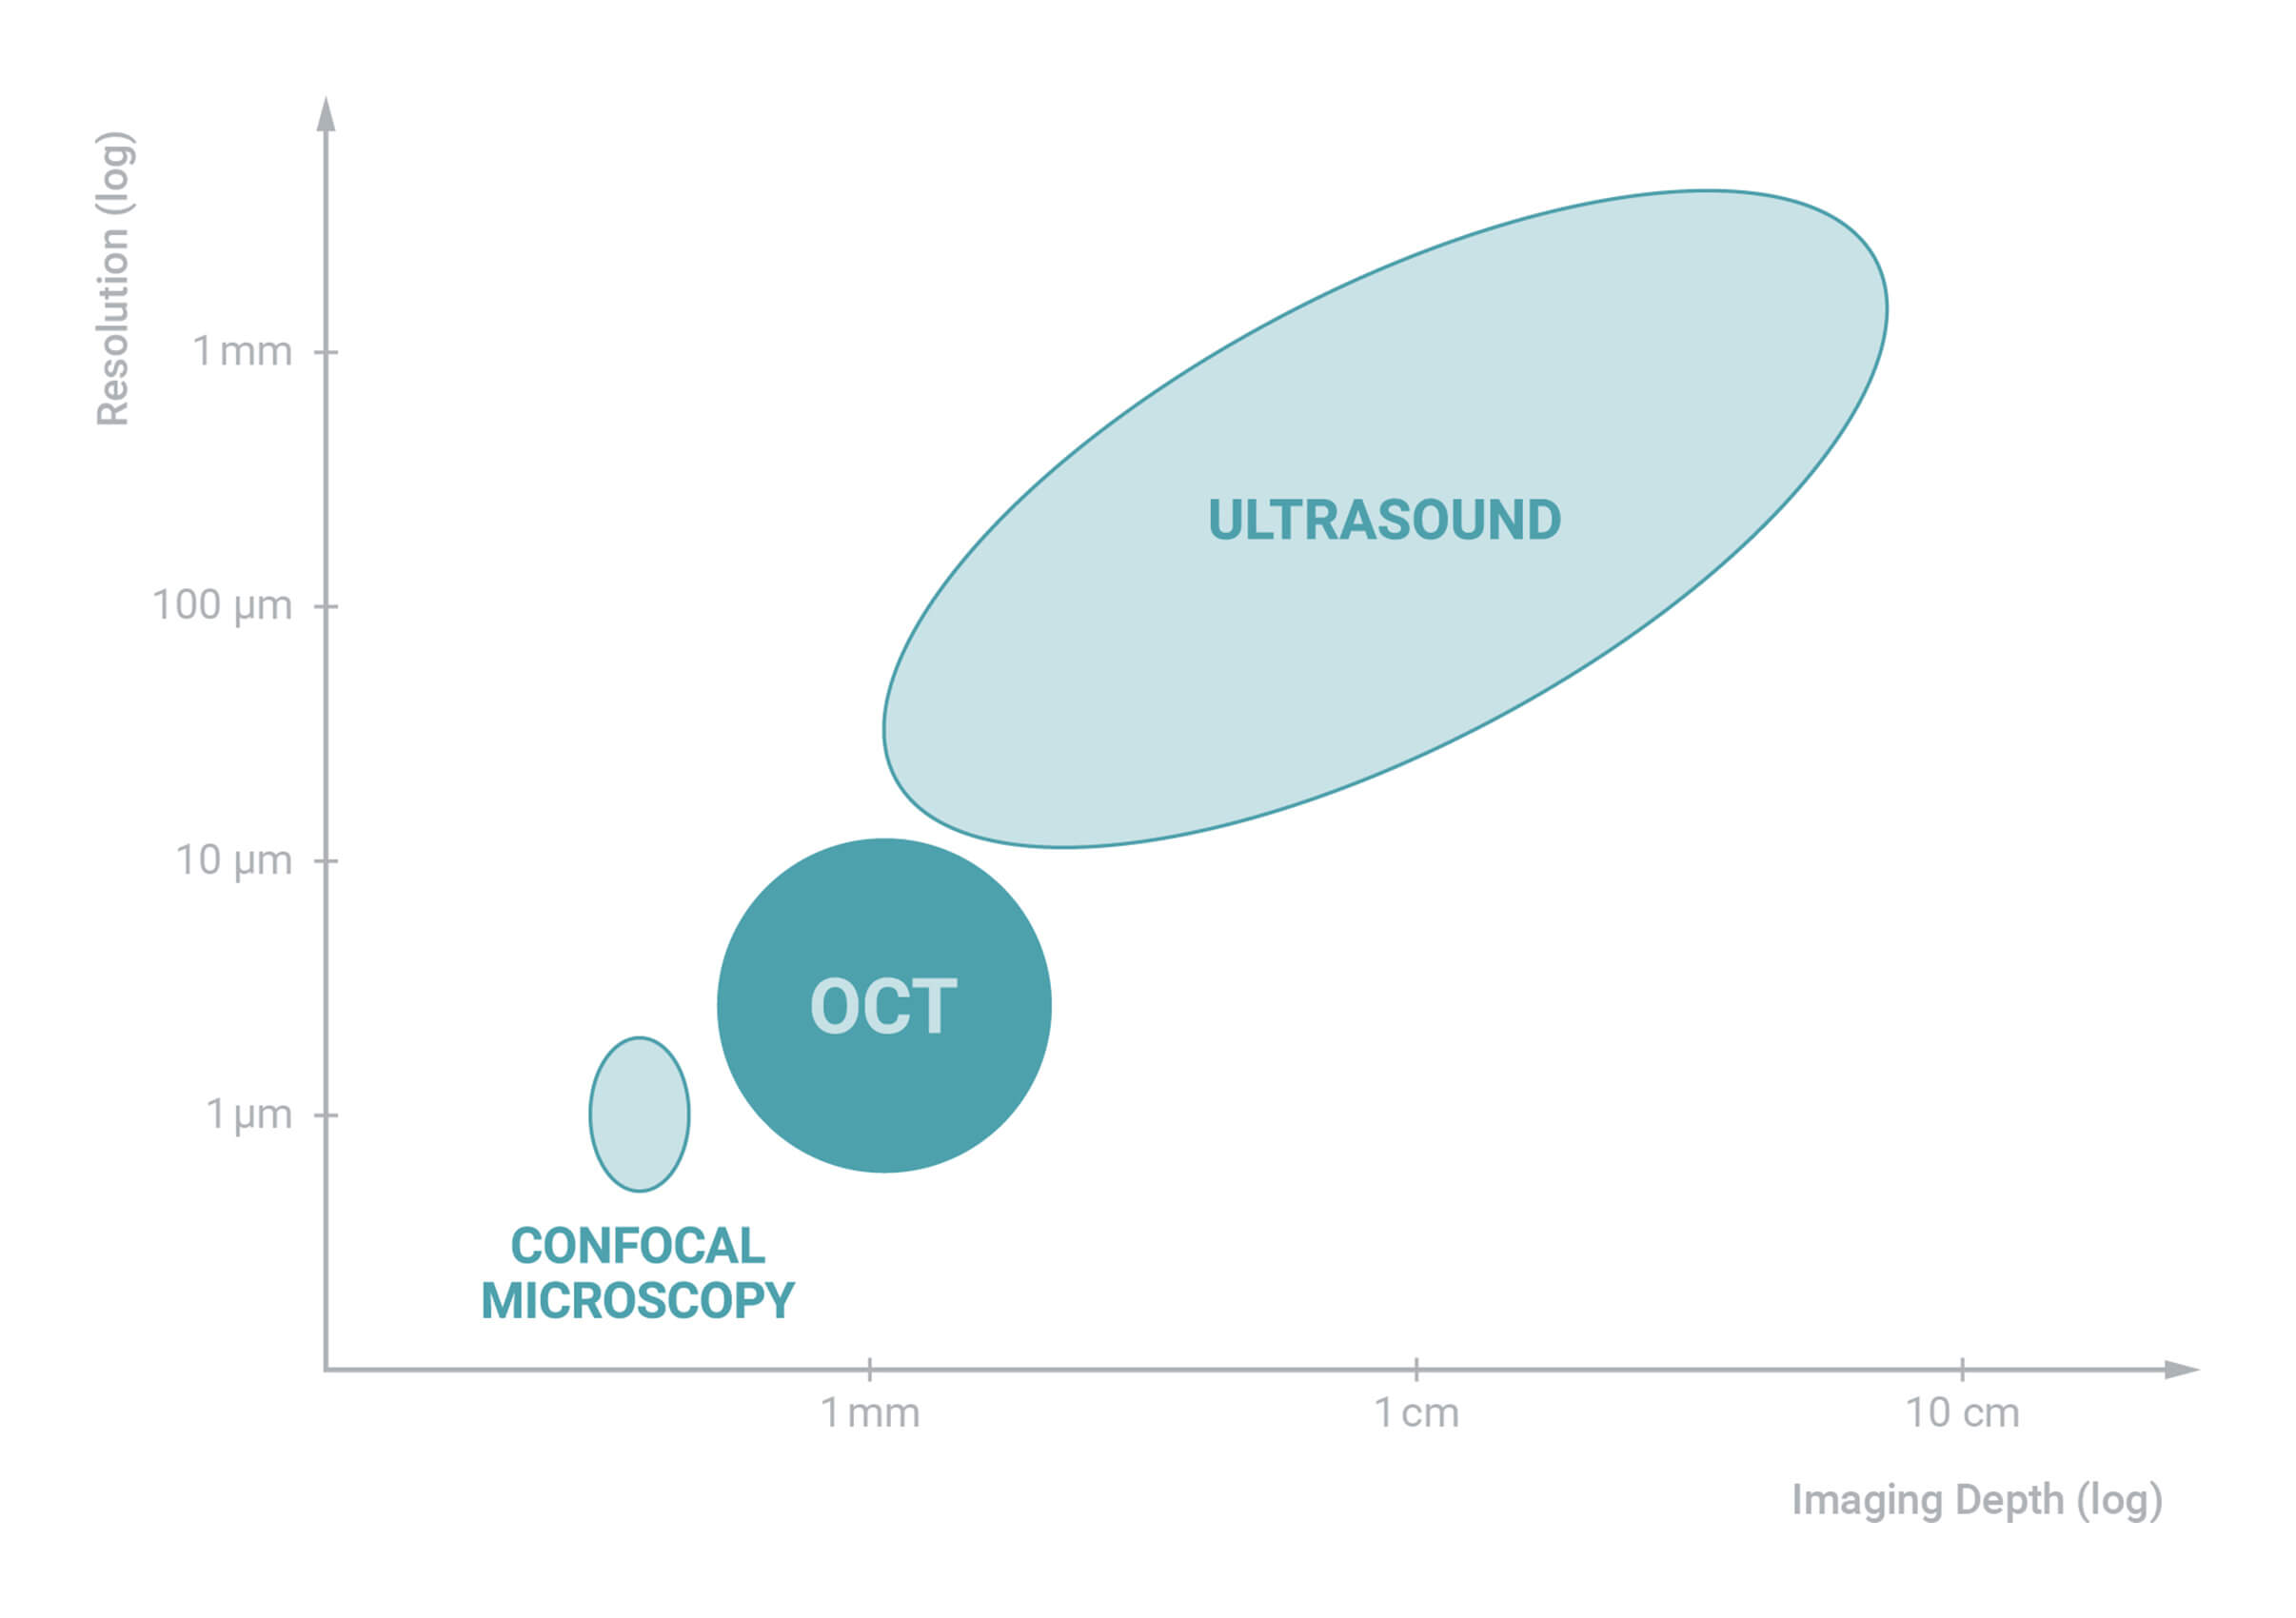
Optical coherence tomography (OCT) is a 3D imaging technique that provides high resolution images of scattering media, non-destructively and without contact or a coupling medium. Axial resolution on the order of a few micrometers is achievable, at imaging depths of up to a few millimeters in scattering material and considerably more in transparent samples.
OCT measures both the surface profile of a sample and the structure beneath it. Because the measurement is fast and requires no preparation, it can deliver this information in real time, which makes it suitable for diagnostics, quality monitoring, and in-line process feedback
How OCT Works
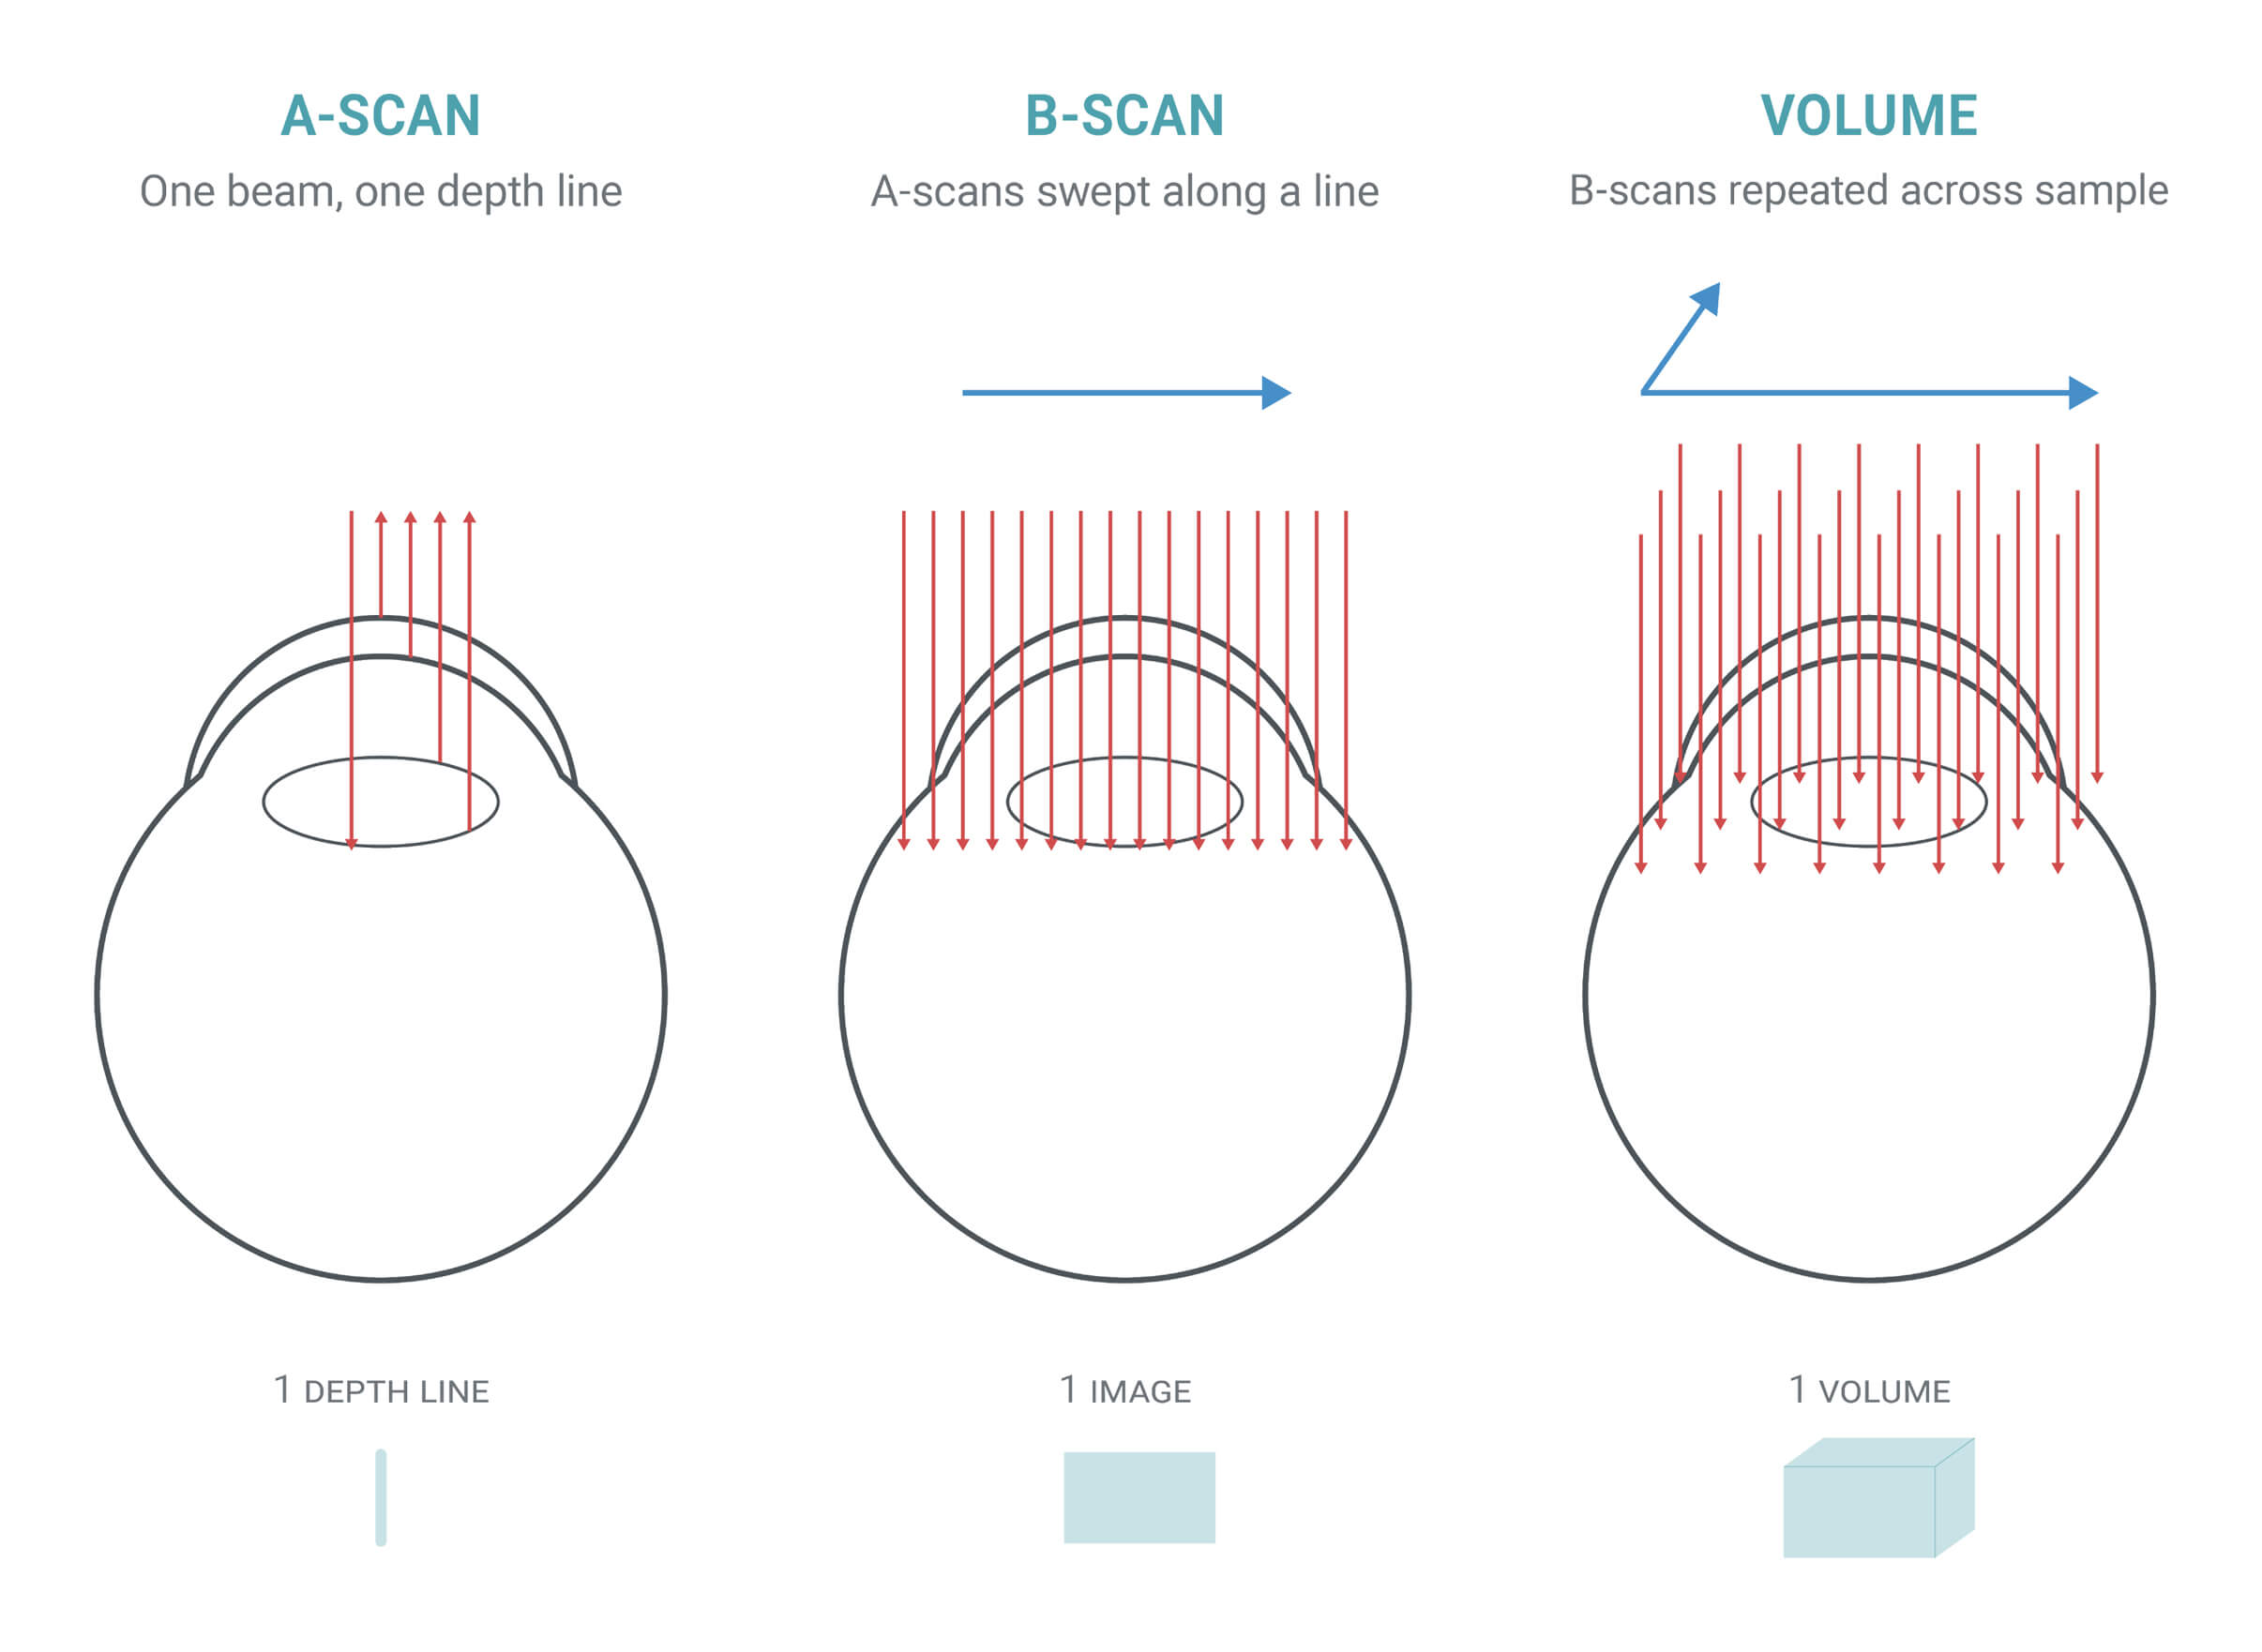
OCT creates images from light back-scattered by structures within a sample. To locate each structure in three dimensions, the system determines both its lateral position across the beam and its depth along the beam.
Lateral information is obtained by scanning the beam across the sample, while depth is measured from the time delay of light reflected from structures at different depths—similar to ultrasound, but using light instead of sound.
Because light travels too quickly for these delays to be measured directly, OCT uses low-coherence interferometry to measure them indirectly. This enables precise depth-resolved imaging with micrometer-scale resolution.
Low-Coherence Interferometry: The Measurement Principle
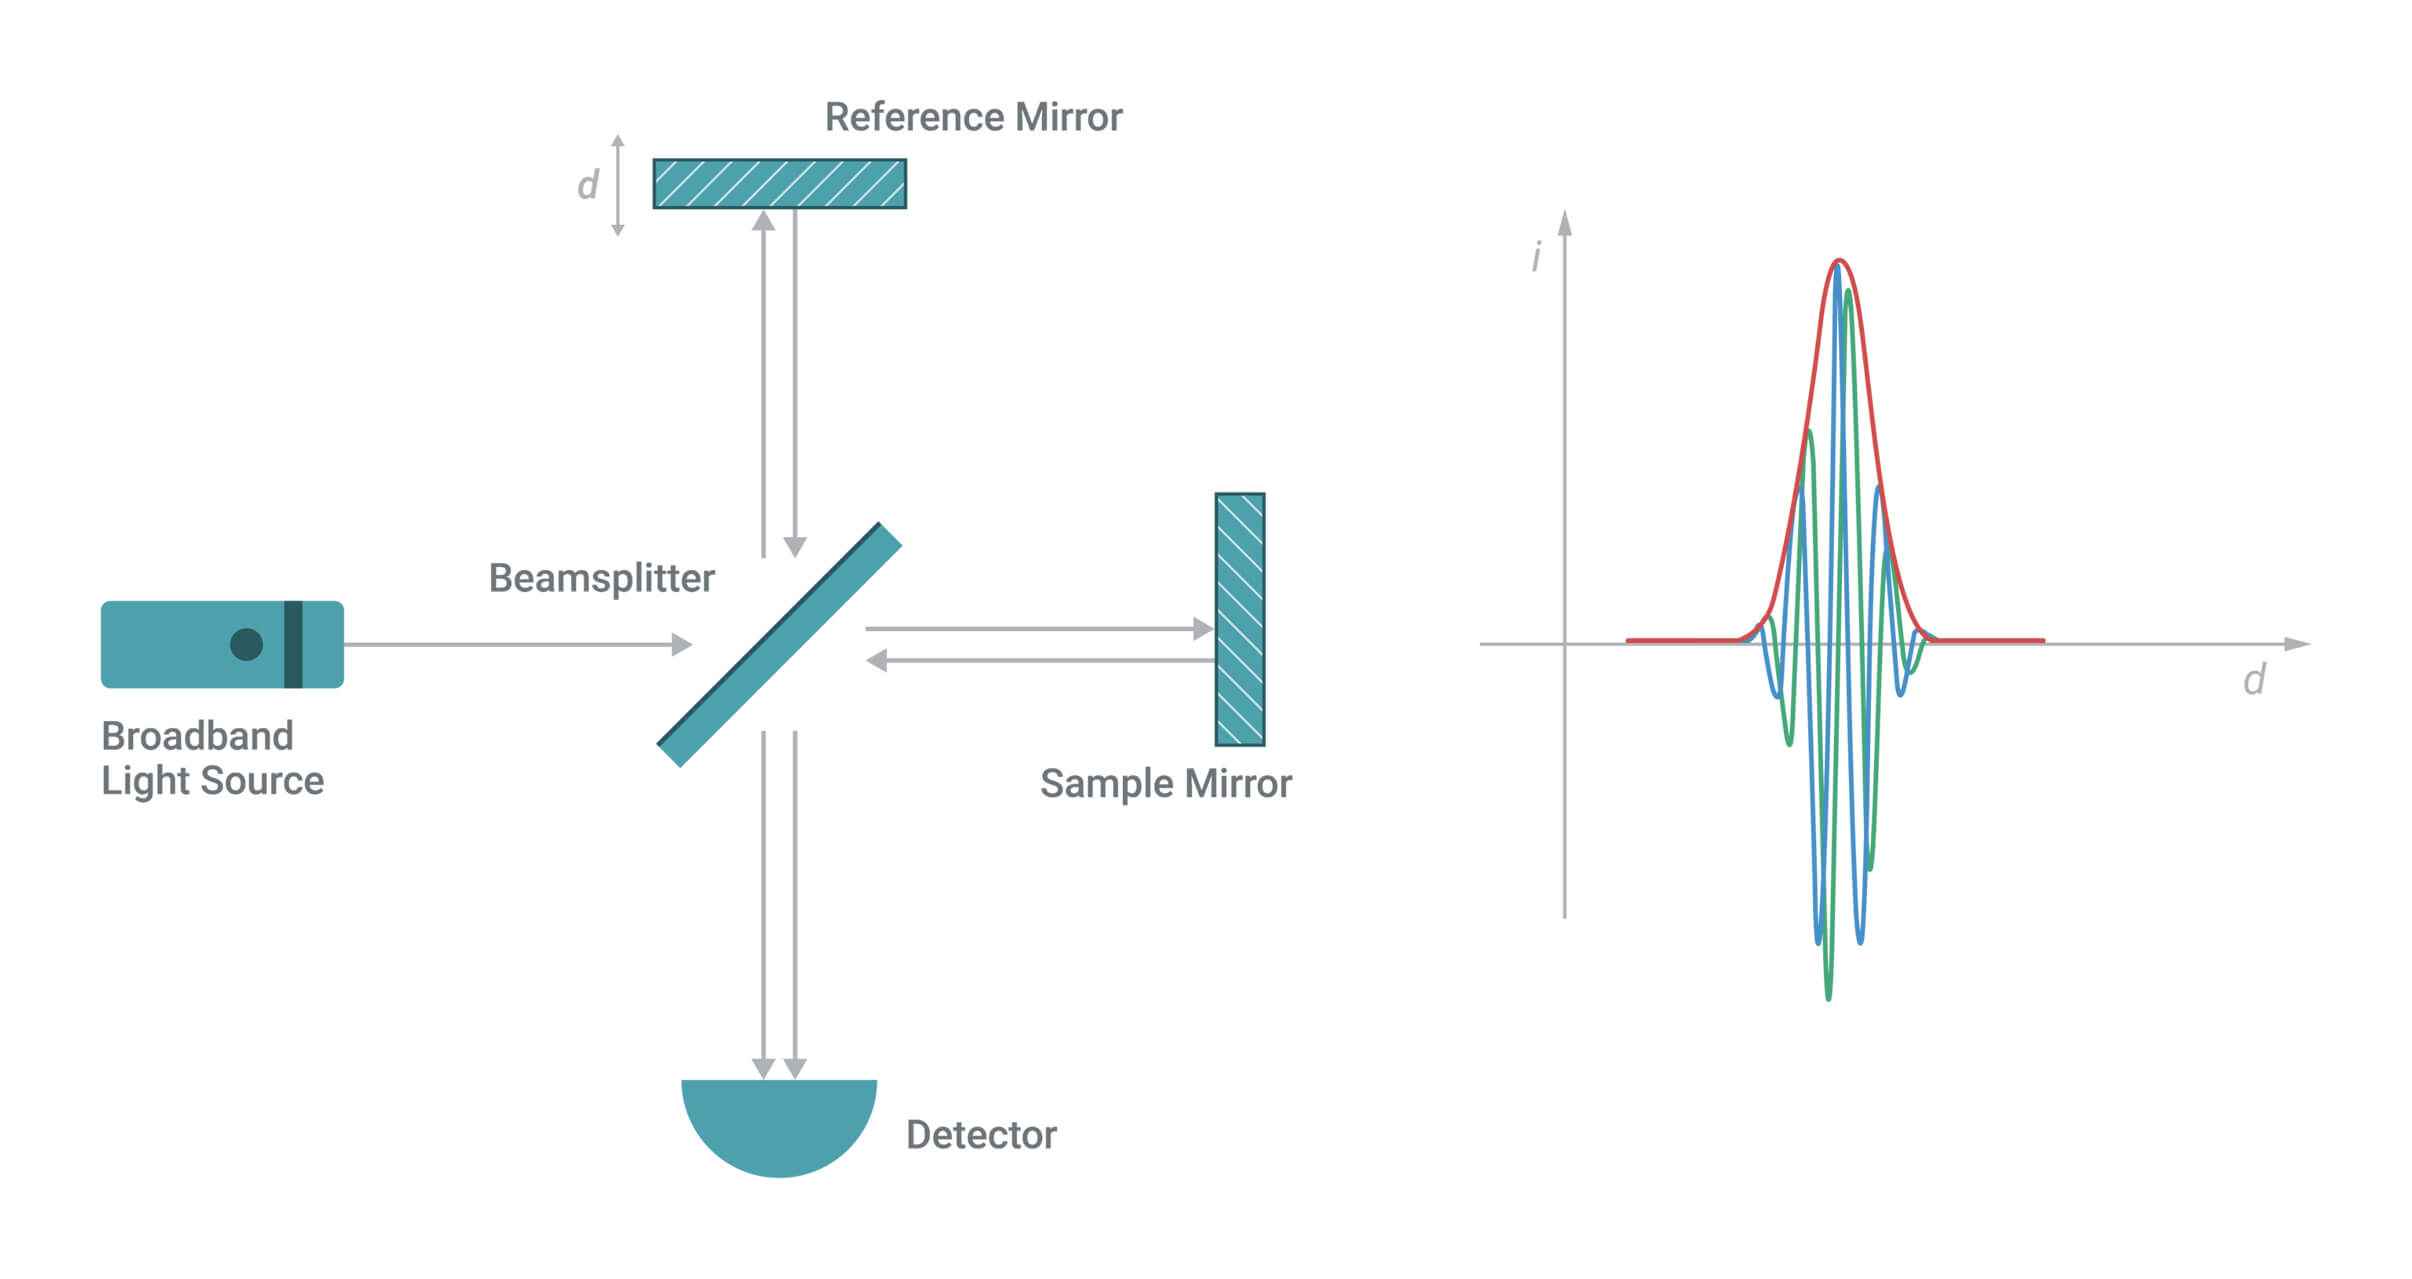
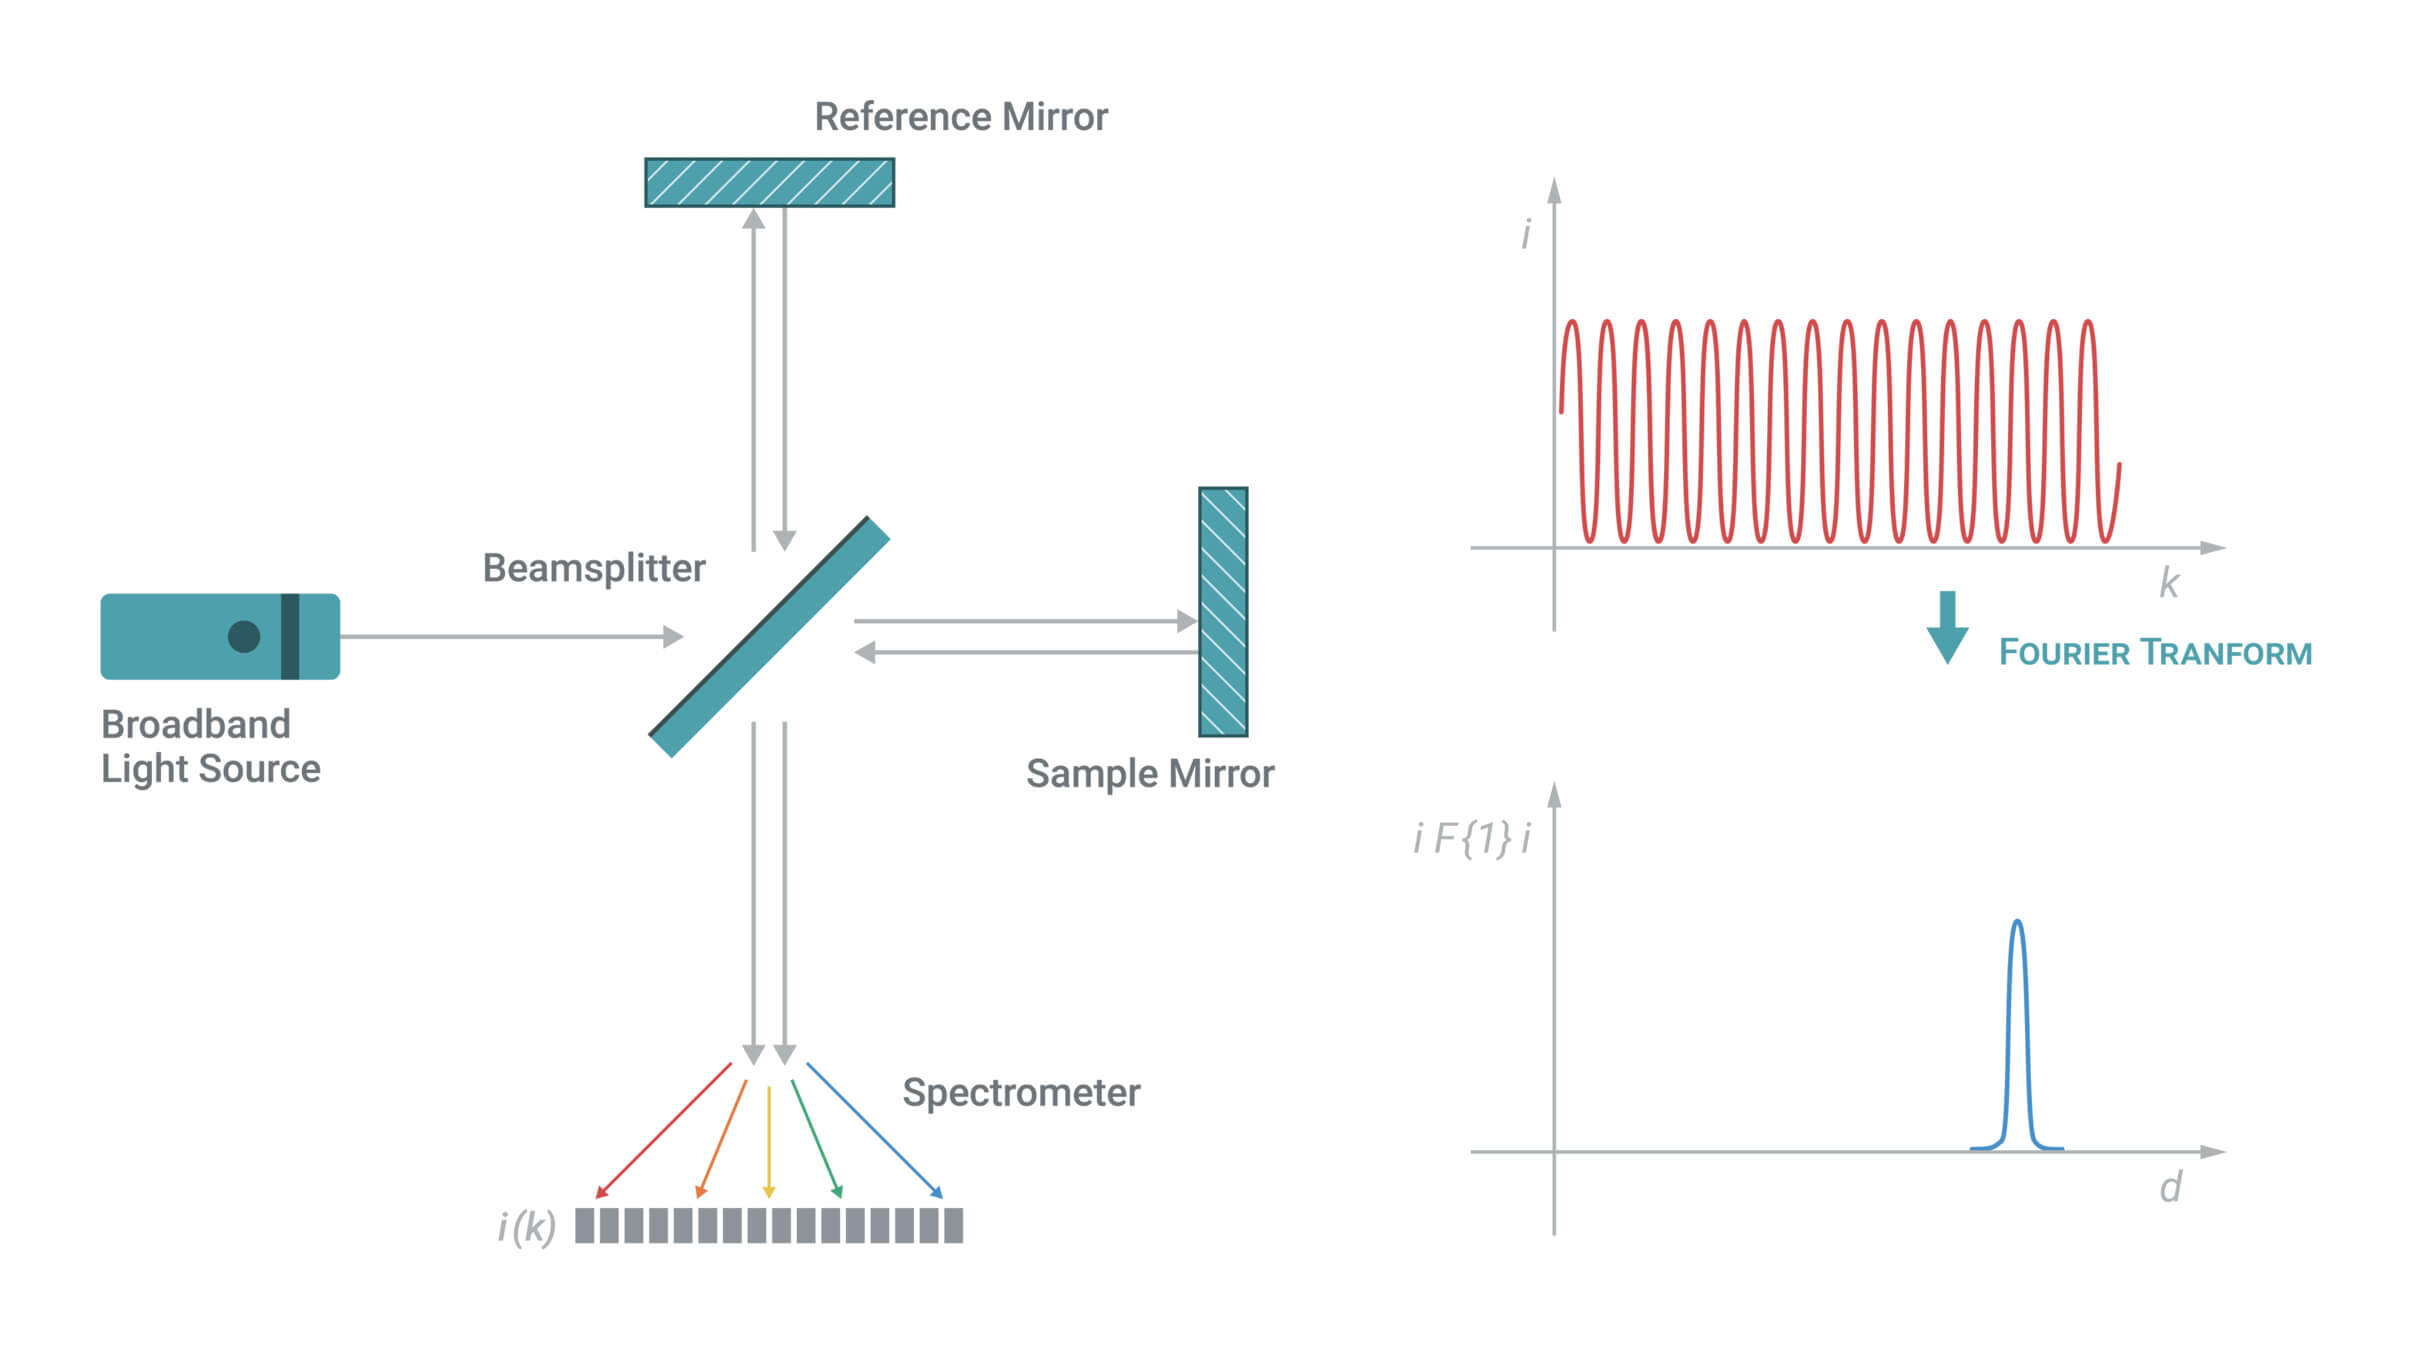
A low-coherence interferometer is illuminated by a broadband light source, which is split into a reference arm and a sample arm. The reflected light from each path is recombined at the detector, where interference occurs only when both beams have traveled nearly the same optical distance. Because broadband light has a short coherence length, these interference signals provide highly precise depth information.
Low-coherence interferometry concept. A fixed reference mirror enables interference measurements between the reference and sample arms.
Low-Coherence Interferometry: The Measurement Principle
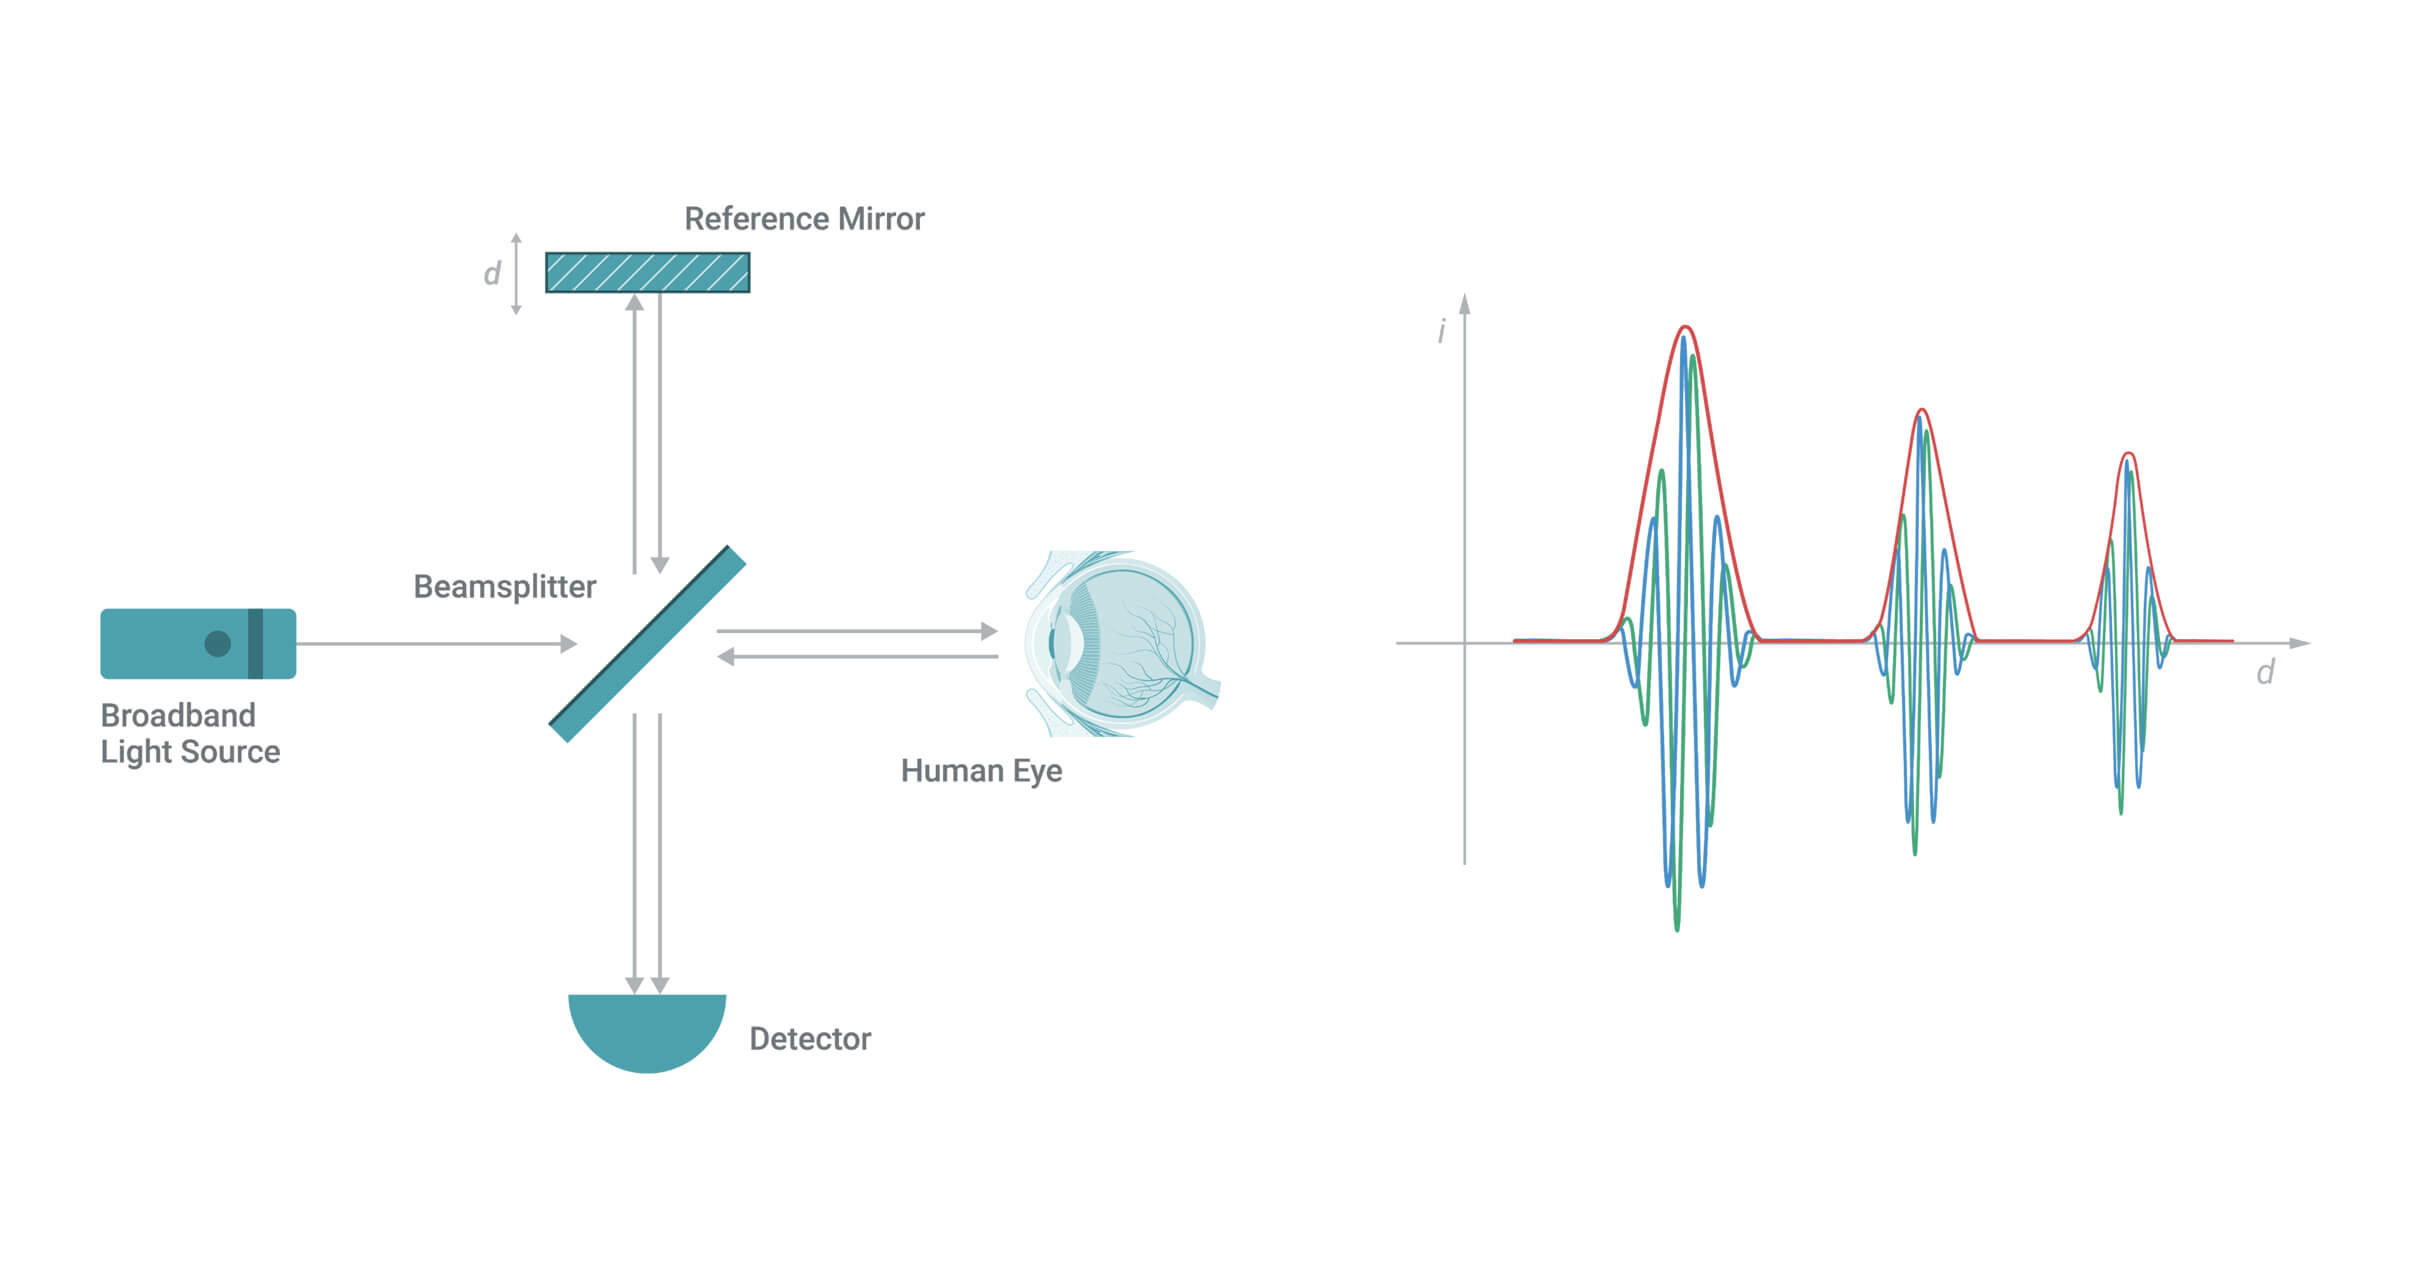
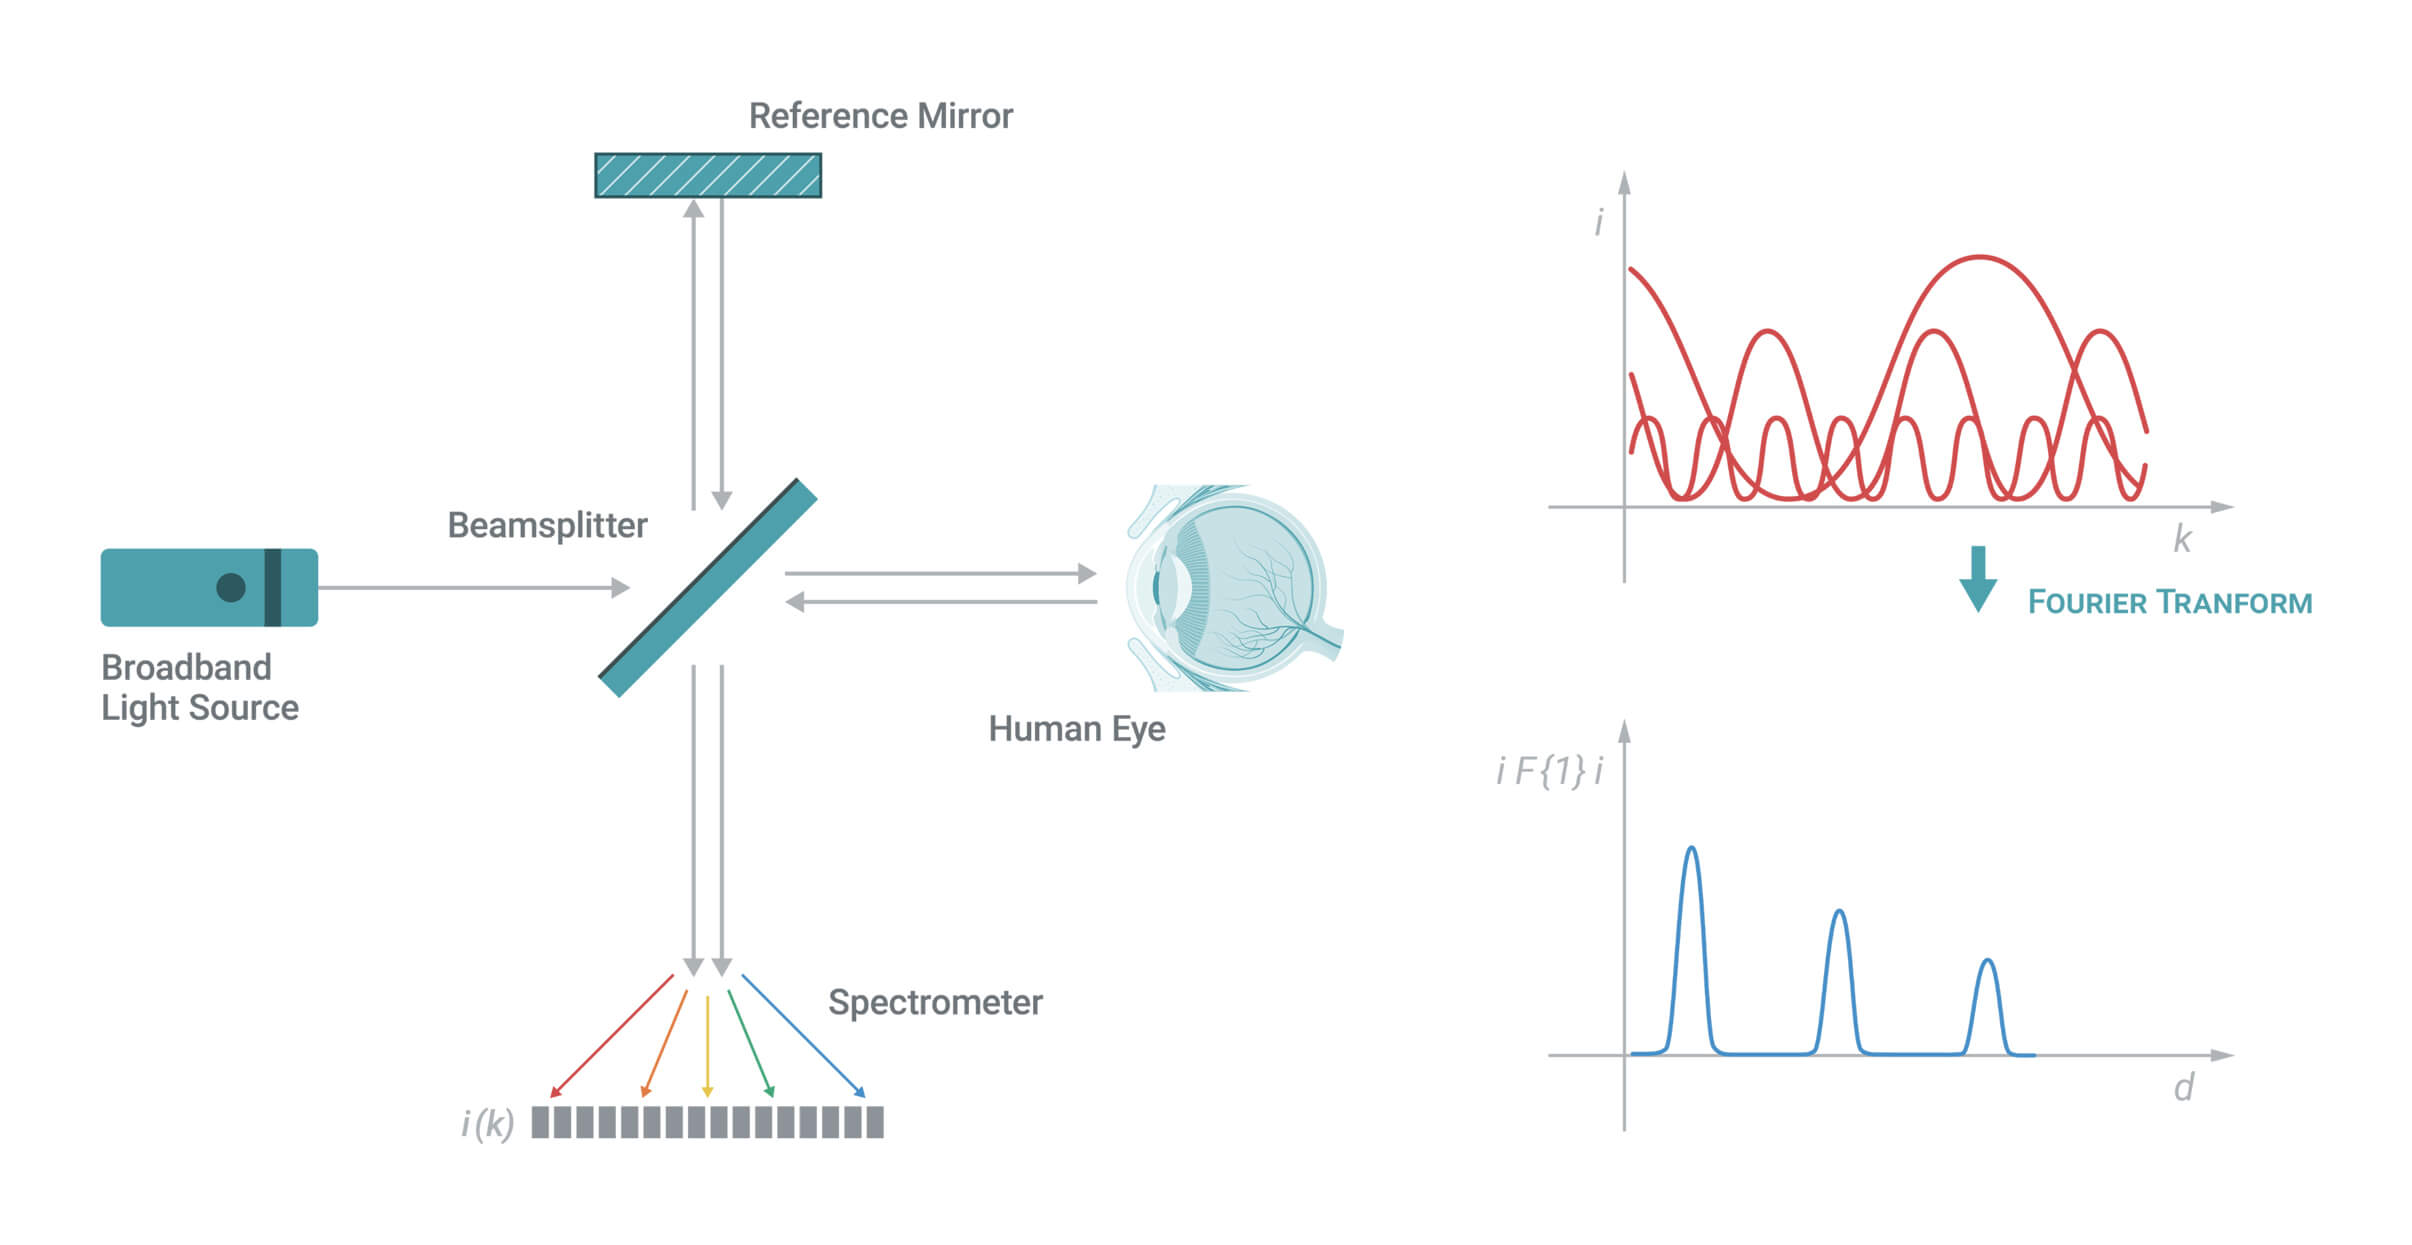
In an OCT system, the mirror in the sample arm is replaced by the sample itself. As light reflects from structures at different depths, interference occurs only when a reflection matches the optical path length of the reference arm. This allows individual reflections to be isolated and mapped, producing a depth-resolved profile of the sample’s scattering properties and enabling high-resolution cross-sectional imaging.
Low-coherence tomography concept, with a sample containing structures at different depths, each of which registers uniquely.
Fourier-domain OCT, in which the mirror arm is kept fixed and interference as a function of wavelength is recorded.
Fourier-Domain OCT: The Method
In early OCT systems, the reference mirror was mounted on a moving stage. Moving it shifts which depth in the sample produces interference, so one sweep of the mirror builds one depth profile. The mirror has to travel for every profile, which limits imaging speed.
Fourier-domain OCT records intensity as a function of wavelength instead of as a function of reference mirror position. This is called spectral interference. Structures at different depths modulate the spectrum at different rates, so the whole depth profile is contained in a single measurement of the spectrum.
A Fourier transform of that spectrum returns the same information that scanning the reference mirror would have given. Because every depth is measured at the same time rather than in sequence, imaging is far faster and the reference arm no longer has to move. What Fourier-domain OCT does not specify is how the spectrum itself is recorded.
Spectral-Domain OCT: The Instrument
Fourier-domain OCT describes the measurement: the spectral interference signal is recorded and then transformed to recover depth information. Spectral-domain OCT (SD-OCT) describes one implementation of this approach, using a spectrometer as the detector.
Light returning from the interferometer is dispersed by a diffraction grating and focused onto a line-scan sensor, which records the full spectrum in a single exposure. Each exposure yields one complete depth profile, with imaging speed determined by the sensor’s readout rate. Because the depth profile is calculated entirely from the recorded spectrum, the quality of that measurement determines the quality of the final image. In an SD-OCT system, the spectrometer is therefore the critical detection stage on which imaging performance depends.
SD-OCT System Design Considerations
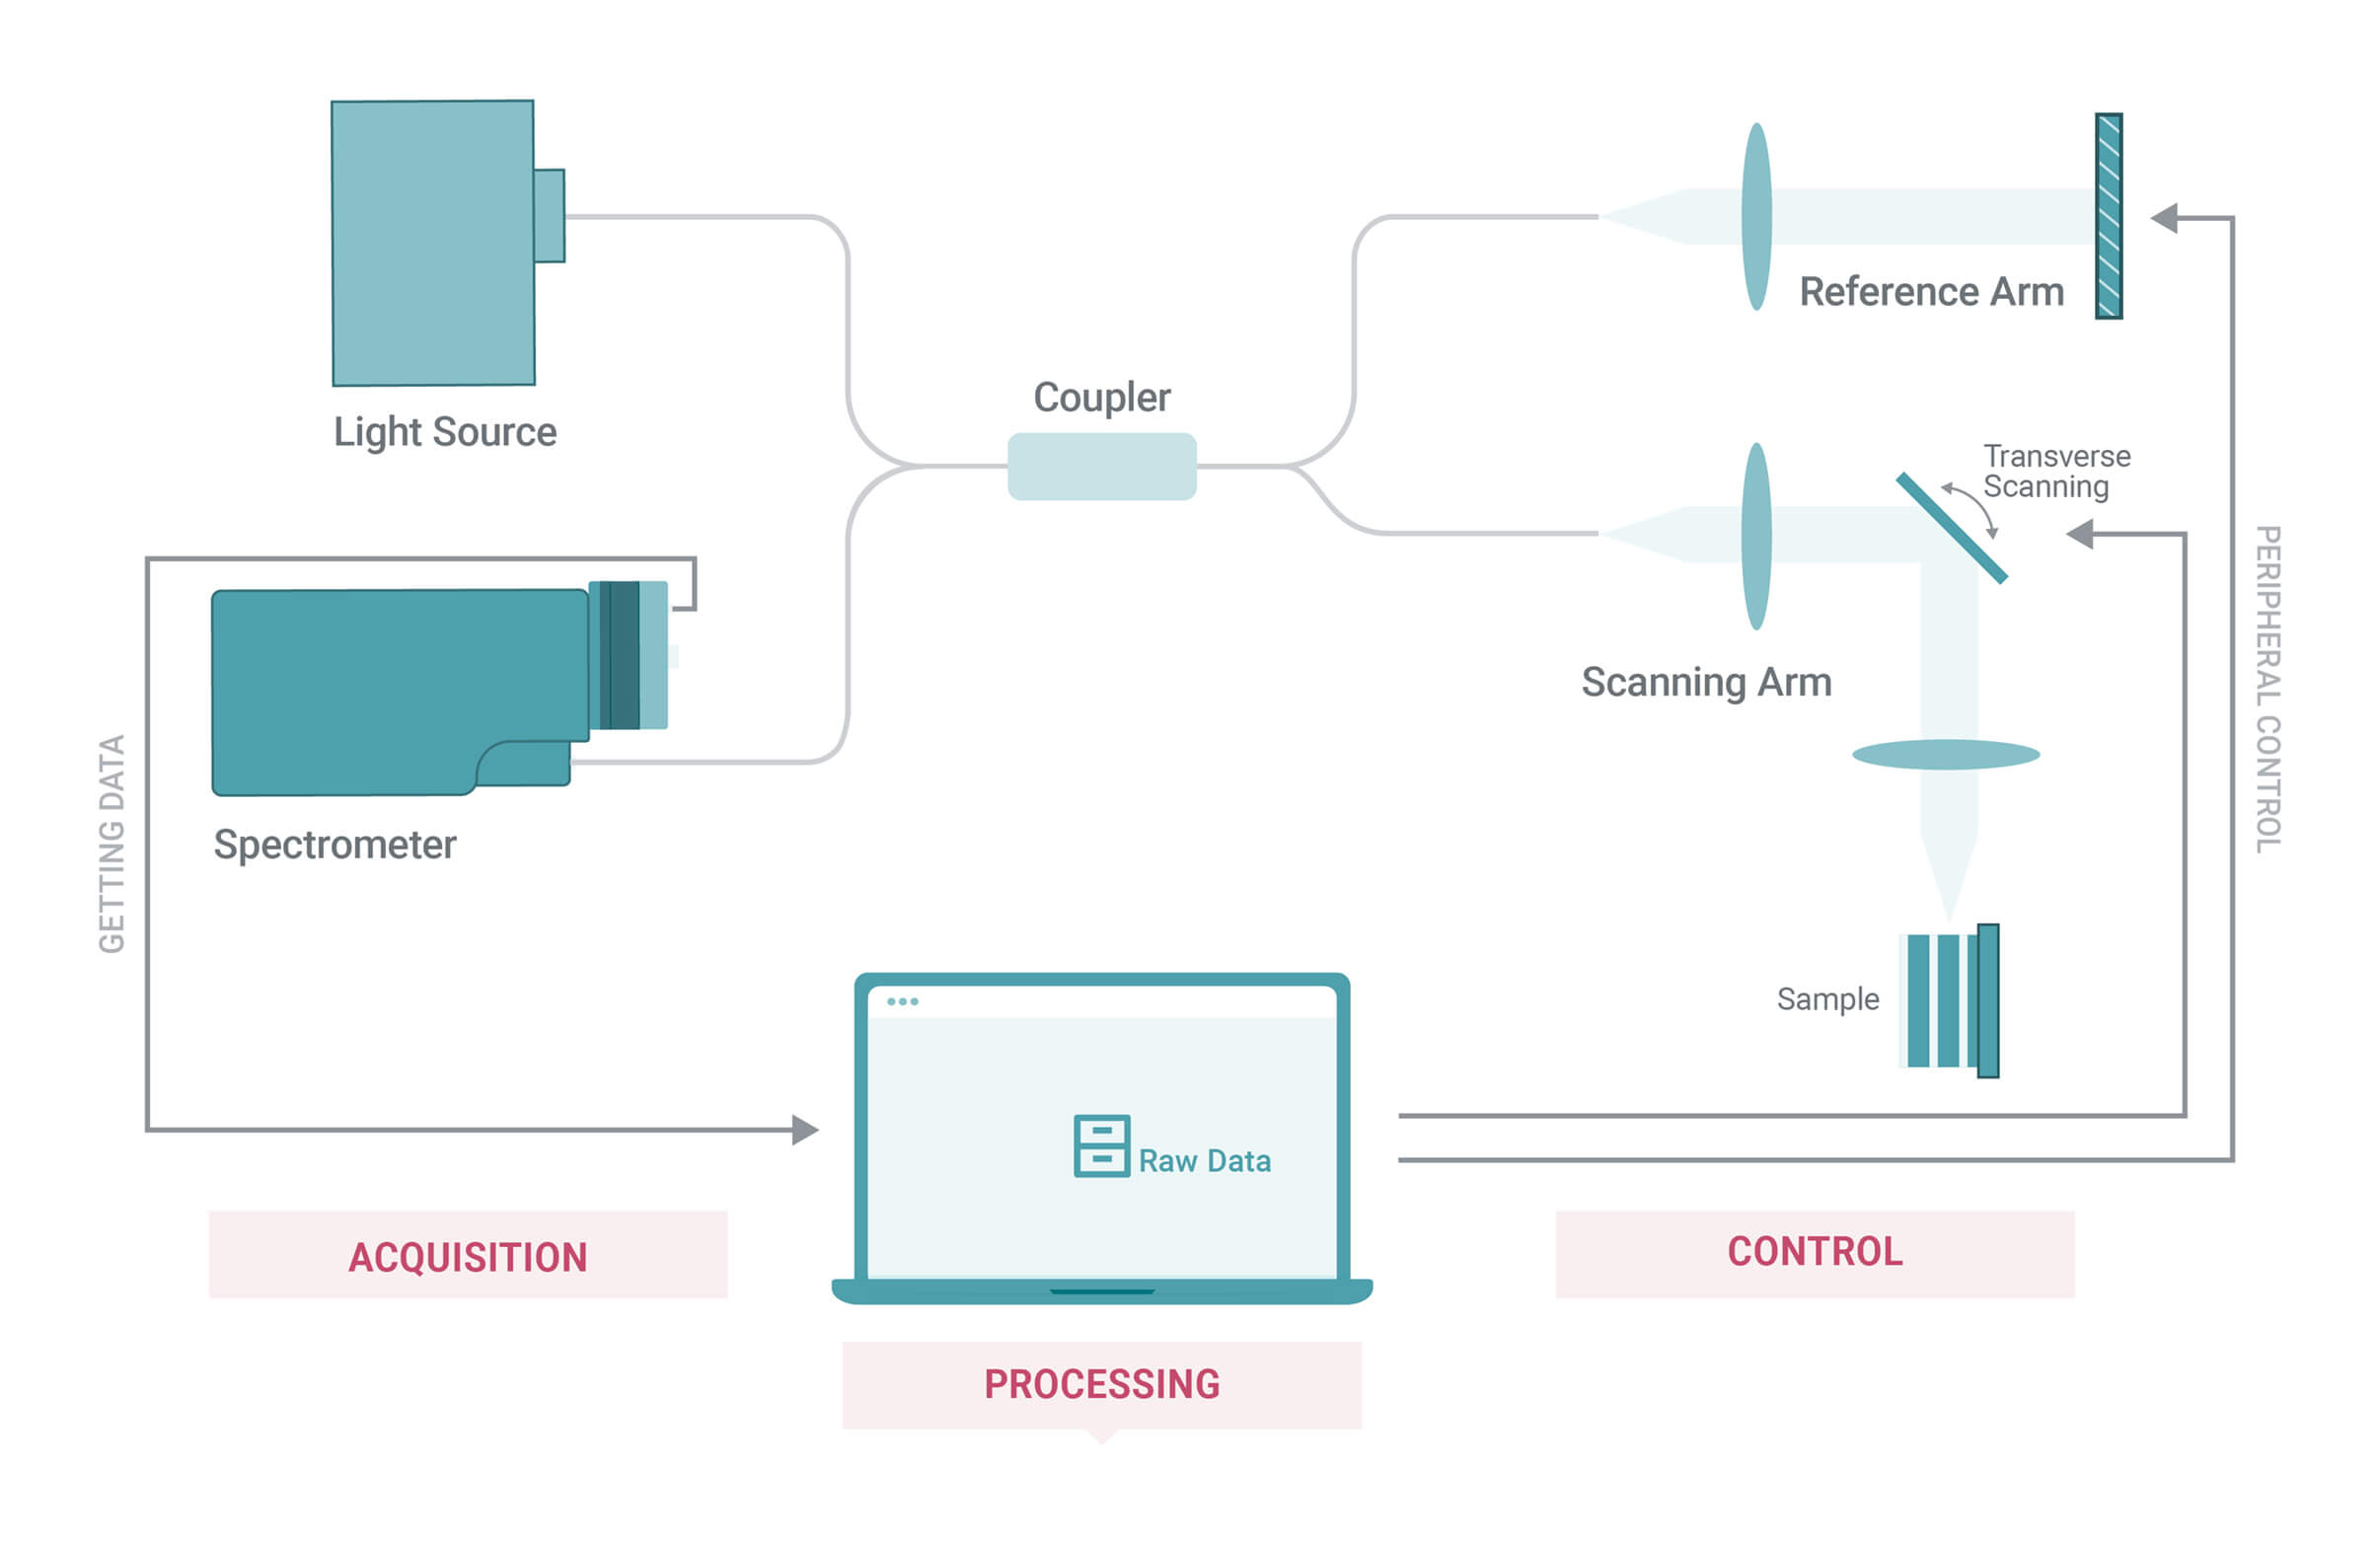
In a spectral-domain OCT (SD-OCT) system, broadband light from a source such as a superluminescent diode (SLED) is split into reference and sample arms. The reflected light is recombined to produce an interference spectrum, which is measured by the spectrometer and converted into a depth profile.
To generate cross-sectional images, the beam is scanned across the sample using a high-speed galvanometer or MEMS scanner. Software synchronizes scanning and data acquisition while reconstructing depth information using fast Fourier transforms (FFT).
Most SD-OCT components—including SLEDs, optical couplers, and reference arms—are commercially available. The spectrometer is the critical detection component that largely determines overall system performance.
Misty Johnson is responsible for taking care of our grating customers at the Logan, Utah, facility. She has been a member of the Wasatch Photonics team since 2009. By understanding her customers’ needs and goals, as well as the current grating market, Misty is able to provide a superior level of customer support. As Account Manager, she acts as a liaison between customers and Wasatch Photonics’ manufacturing department making sure that the lines of communication are always open.
Customer support is an integral part of Wasatch Photonics commitment to customers. Whether you are in the market to purchase a single grating, inquiring as a distributor, or purchasing large volume, Misty will guide you seamlessly through the custom design process. Misty strives to build trust and strong long term relationships with Wasatch Photonics customers. She brings 20 years’ experience as customer support manager from a number of manufacturing and service companies.